


Photo by Levi Meir Clancy on Unsplash
Analysis of Medical-Appointment-Showups
Analysis of Patients' No-Shows on their Medical Appointment Day


Table of contents
- Introduction
- Problem Statement
- Data Sourcing
- Methodology
- Exploratory Data Analysis
- Research Q1: Which patients' age group has a better show up best on their appointment day?
- Research Q2: What variables are closely associated with the age group that has the highest attendance?
- Visualizing Association Between 'sms received' and patients who showed up based on their age groups
- Visualizing Association Between 'alcoholism' and patients who showed up based on their age groups
- Research Q3: What factors are important for us to predict whether a patient will show up for their scheduled appointment?
- Visualizing Appointments Attended and Not Attended
- Visualizing Association Between No_show and Gender
- Visualizing Association Between No_show and Chronic Diseases (Hypertension and Diabetes)
- Visualizing Association Between No_show and Wait time
- Conclusions and Recommendations
- References
Introduction
In my previous post, I shared with you the simple, yet powerful approach to Data Analysis. In this article, I will be showing you a step-by-step guide through my recently concluded data analytics project. This project analysis is descriptive in nature and is my first real project in the field of Data Analytics. Also, this project was completed as part of the primary requirements for completing my Data Analytics Nano Degree with ALX-T Udacity. To make the most of this project, I collected the medical data from a source, ask questions about it, explored the data to answer these questions, identify patterns and insights, and give recommendations or predictions. A no-show implies that a patient did not honor his/her medical appointment. This project was done using Python programming language. Note that similar results could be arrived at using other languages or software.
I primarily choose to work on this project because I was concerned that whenever a patient misses his/her appointment, there is a high tendency that such a patient's condition worsens.
Problem Statement
Hospitals need to understand the pattern with which their patients show up for their treatment on the appointment days. Patients who register for medical appointments sometimes do not make it to the hospital on their appointment days. This can further worsen the health of the patient due to delayed treatment or diagnosis. Furthermore, the hospital's utilization of spaces and human resources can be negatively affected due to wasted time and slots. It is also a concern that other prospective patients lose out on their right to treatment due to already allocated spaces. Several factors are responsible for a patient's no-show, and the main purpose of this project is to explore the variables in this dataset, and group patients based on these to provide an understanding of variables most associated with patients who showed up and those who did not.
This project was guided by the following research questions:
- Which patients' age group has the best show up on their appointment day?
- What variables are closely associated with the age group that has the highest attendance?
- What factors are important in predicting whether a patient will show up for their treatment?
Data Sourcing
The data for this study was initially collected from patients who lived across 83 regions in Brazil and made available for public use on kaggle. The dataset was simply downloaded from this kaggle page.
Methodology
The Python libraries used on this project were Numpy, Pandas, Matplotlib, and Seaborn. All visualizations were done using Numpy and Matplotlib library. The GitHub repository for this project can be found here, while the Jupyter notebook can be viewed here
The Analytical processes employed in this Analysis are as follows:
- The Data was first wrangled (gathered, accessed, and cleaned) to ensure it's of the right quality, and structure suitable for the analysis.
- The data was then explored to spot relationships among; and behaviors of variables. Several features were also extracted from existing variables at this stage
- Basic statistical summaries were carried out to manipulate variables and features
- Visualisation of Results
- Conclusions
Exploratory Data Analysis
Research Q1: Which patients' age group has a better show up best on their appointment day?
The Patients' Ages were classified into "Age groups" that allowed for easy handling and also provided a wider perspective of the age factor.
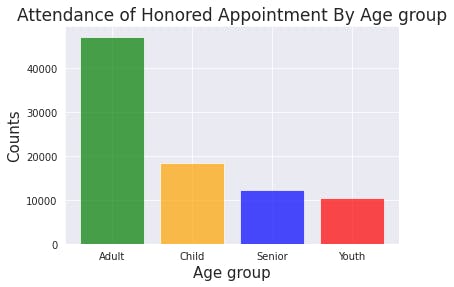
The bar chart above shows that among the age groups, adults, with a frequency of 47 237, generally honor their appointment compared to the rest of the patients. The older adults (seniors) have a rather low attendance frequency (12 169) compared to the Adults.
Research Q2: What variables are closely associated with the age group that has the highest attendance?
To answer this research question, the variables 'sms received', 'alcoholism', and 'scholarship' were explored.
Visualizing Association Between 'sms received' and patients who showed up based on their age groups
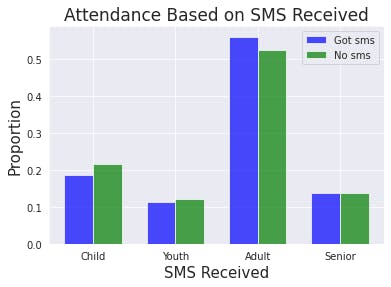
Based on the information on this chart, a slightly higher proportion of patients attended their appointment without receiving an sms as a reminder across all age groups. However, the proportion among the adults shows that more adults attended when they receive an sms. Overall, the difference does not appear to be significant enough. This variable will therefore not be considered an important factor in predicting if a patient will show up for his/her appointment.
Visualizing Association Between 'alcoholism' and patients who showed up based on their age groups
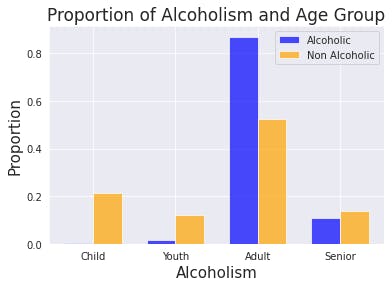
The above chart displays the relationship between Alcoholism and Age groups among patients who honored their appointments. A large proportion of alcoholics among the adults honored their appointments.
Research Q3: What factors are important for us to predict whether a patient will show up for their scheduled appointment?
To answer this question, several variables will be explored to study their relationship with patients who honored their appointments and those who did not.
Visualizing Appointments Attended and Not Attended
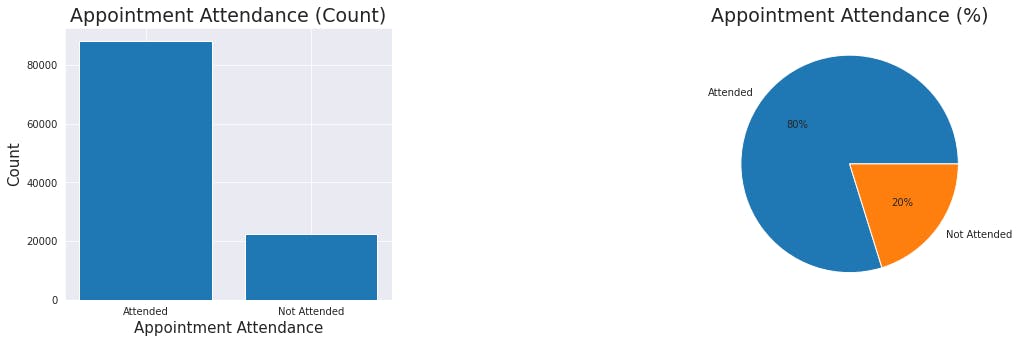
The charts (directly) above shows the attendance of patients who showed up and those who did not. The bar chart shows the plot of the count of patients who attended and those who did not. The pie chart shows the proportion of attendance in percentages.
Visualizing Association Between No_show and Gender
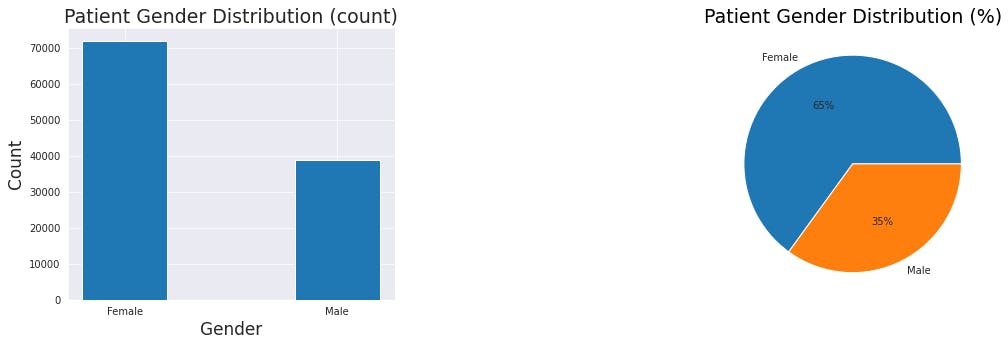
According to the charts (directly) above, it can be seen that overall, there is a higher number of female patients than the male patients.
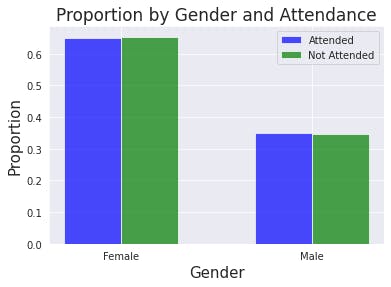
Though the number of female appointees is greater than that of the males, their proportions are very similar. The bar chart above shows that both proportions of males and females are the same. There is no difference between male and female attendance. This variable 'gender' will therefore not be considered an important variable in predicting if a patient will show up.
Visualizing Association Between No_show and Chronic Diseases (Hypertension and Diabetes)
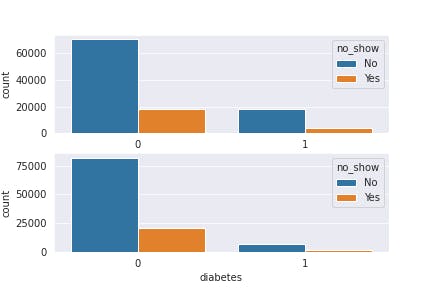
chart 1 describes no-show for patients with hypertension
chart 2 describes no-show for patients with diabetes
Visualizing Association Between No_show and Wait time
The "wait time" represents the period between the "scheduled day" and the "appointment day".
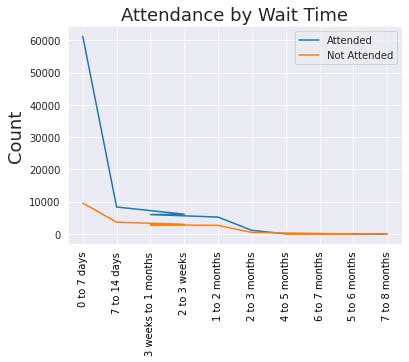
The line plot of wait_time_category against 'no_show' reveals there is an incredibly high turnover of patients for their appointments when the period of days between the scheduled day and the appointment day is between 0 to 7 days. The result of this analysis suggests that there is a strong relationship between shorter wait times and better turn up for patients' appointments.
Conclusions and Recommendations
It was discovered that the 'adults' generally honor their appointments better than any of the other age groups. Further investigation was carried out to suggest factors responsible for this and it was discovered that alcoholic adult patients show up better on their appointment days.
The 'wait_time' was found to be most associated with whether a patient will show up or not. Also, patients who did not have any chronic disease (hypertension and diabetes) appeared to show up better on their appointment days. These two variables according to the analysis in this report should be considered important factors that can be used to predict if a patient will show up or not.
Based on the findings of this project analysis, it is recommended that hospitals look into their method of scheduling, as patients who did not have to wait any longer than a week generally make it to their appointment. Also, hospitals should pay special attention to patients with diabetes, and hypertension by making available some form of provisions for that might increase their attendance rate in the future.
One limitation of this analysis is that no special statistical technique was used in carrying out any of the analyses. This analysis did not expressly investigate the direct cause of patients behaviours. As a result, the inferences do not imply causation.
References
All references used for this project have been hyperlinked within the write-up. For the complete Python code written on Jupyter Notebook, GitHub repo with the dataset, and my social media pages, please use the links below: