

The Simple, yet Powerful Approach to Data Analysis


Photo by Stephen Phillips - Hostreviews.co.uk on Unsplash
Have you ever wondered what are the steps in data analysis? Or have you ever imagined what a typical data analysis process looks like? Perhaps, you are confused as to what a typical data analyst does with data. Don't worry you're not a weirdo. I was once like you. The enthusiasm and curiosity to learn about data analytics and what it has to offer only confirms you are made for more. Whether you are completely new to data analysis, or you already have an idea of what it entails. This article is made just for you. I will introduce you to data analysis and walk you through the 5-steps process of analyzing any data of interest.
Data Analysis as a Concept
According to Wikipedia, Data analysis is a process of inspecting, cleansing, transforming, and modeling data to discover useful information, informing conclusions, and supporting decision-making. Don't mind all those fancy words up there. Simply saying, data analysis is a process of checking your data for faults, correcting those faults, modifying the data to become suitable for analysis, and replicating your data in smaller versions to discover useful insights that support decision-making.
Who is a Data Analyst?
 Photo by Kues1 on freepik
A data analyst is simply a person who collects data, cleans data, and interprets data in order to answer questions, solve problems and provide recommendations. A data analyst is welcomed across numerous industries and organizations. Data analysts work in industries that include business, finance, science, medicine, and government. A data analyst usually has proficiency in the use of software such as Microsoft Excel, Microsoft PowerBi, Tableau, and some programming languages such as Python, R, SQL, and so on (more about this in my future posts).
Data Analysis Process
 Source: Accounting photo created by rawpixel.com
Analyzing data is crucial in making informed decisions. Hospitals, Pharmaceutical Companies, and Businesses generally rely on the output of analyzed data in order to make data-driven decisions. This important need requires that the process of analyzing data is fast, efficient, communicative, and useful. The process of data analysis will be broken down into 5 steps
Step 1. Asking Questions

This is a very important part of any analysis. You are either given data (by your organization or employer) and asked questions based on it, or you ask questions first and gather data based on the questions asked. Whatever is the case, asking great questions helps a data analyst focus on the relevant parts of the data and directs the analysis toward meaningful insights. Questions asked are also termed research questions, and they guide the data analyst through the remaining steps of the data analysis process.
Step 2. Wrangling Data
 After asking the right questions comes wrangling. Data wrangling is arguably the most extensive step of the data analysis process. Most of the world's data are dirty and messy. Wrangling the data ensures that the data is of the right quality for analysis. There are three parts to this step;
- Gather
- Assess
- Clean
The data analyst typically gathers the data needed to answer the questions, assesses the data to identify any problems in the data’s quality or structure, and cleans the data by modifying, replacing, or removing data to ensure that the dataset is of the highest quality and as well-structured as possible.
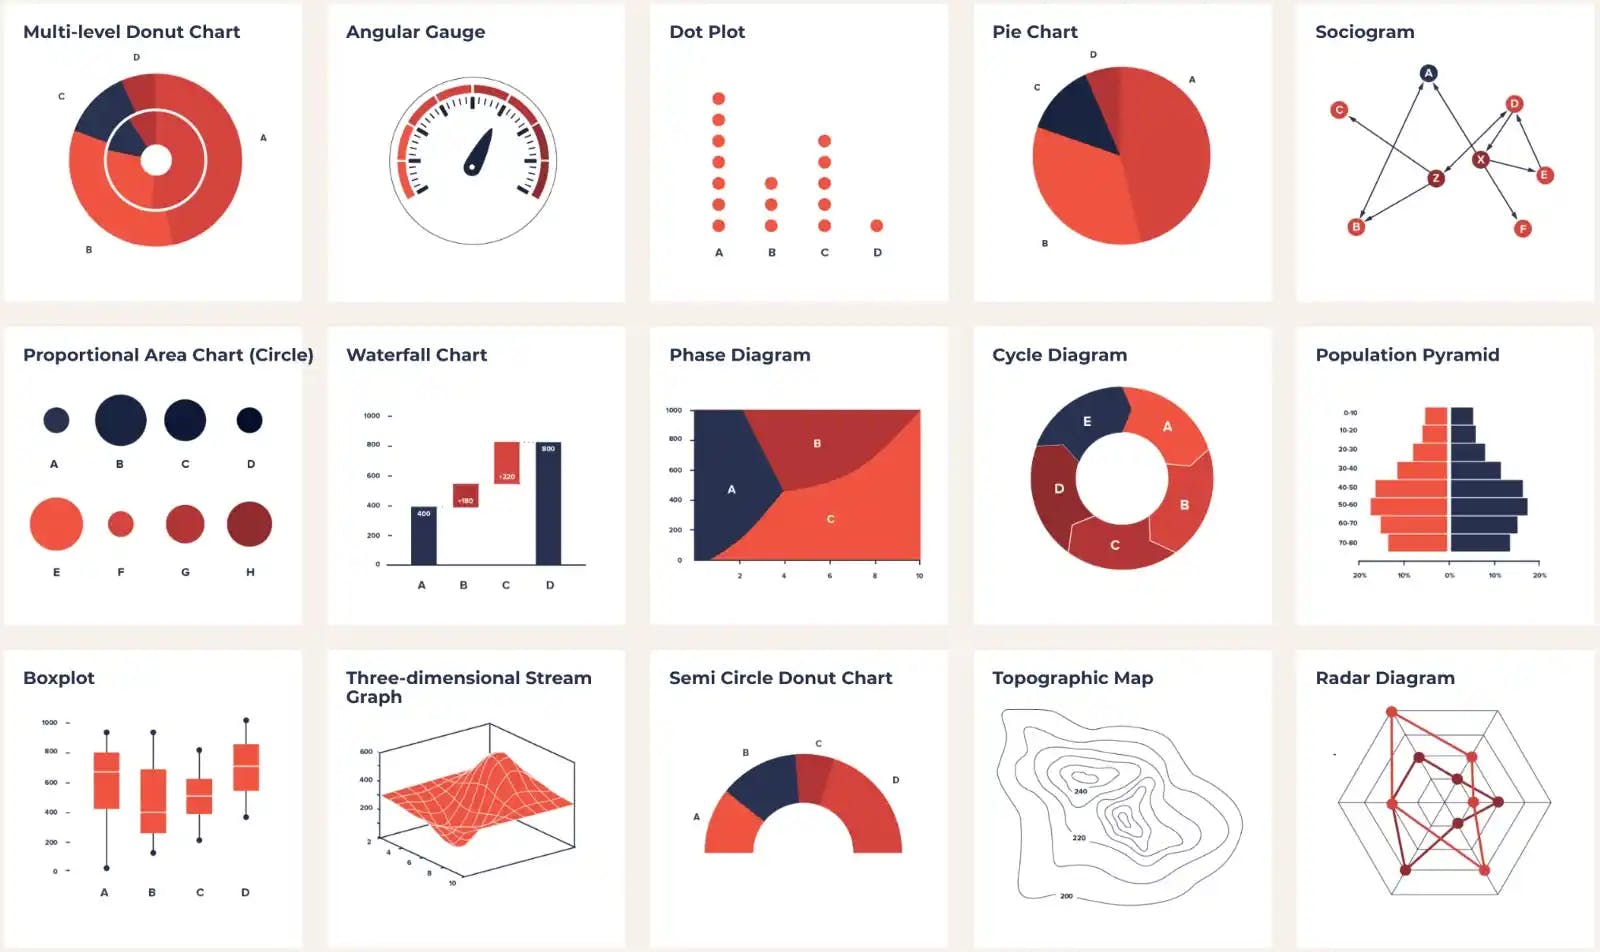
Step 3. Perform Exploratory Data Analysis (EDA)
 Source: devopedia.org
Once the data is available in a form suitable for analyses, the next step is to perform Exploratory Data Analysis. . Exploring the data involves finding patterns in the data, visualizing relationships in your data, and building intuition about what you’re working with. After exploring, the data analyst can do things like remove outliers and create better features from the data, also known as feature engineering. This step helps the data analyst to maximize the potential of the variables present in his/her dataset by providing rich analyses, visualizations, and models.
Step 4. Draw Conclusions
 Photo by
 At this step, the data analyst makes conclusions (sometimes predictions), based on the analyses carried out in the previous step. This step is typically approached with machine learning. You can learn more about machine learning here.
Step 5. Communicate your results
 Photo by
 A data analyst often needs to justify and convey meaning in the insights found. At this step, the data analyst shares what he/she has found or built. The data analyst explains how design decisions were made, and reports how well it performs. There are many ways to communicate results: reports, slide decks, blog posts, emails, presentations, or even conversations. Data visualization is always valuable when communicating results.
Found this helpful? Please leave a like and share to others.
Don't forget to keep the data alive Data is Matter!